HDElk is a web-based diagramming tool designed to permit the easy visual representation of diagrams which feature sets of interconnected nodes in web pages. The diagram is described in JSON and then rendered in SVG
One area that uses interconnected nodes is FPGA programming in Hardware Description Languages (HDL’s) like Verilog and VHDL. HDElk came about in response to a need to document an FPGA library, but it is not limited to FPGA applications.
What follows is an overview of the project, but if you’re eager to get in to the details, here are the quick links.
Motivation
There are many many diagramming solutions, so why HDElk? WYSIWYG editors are high touch, by design. This means it is sometimes hard to control the look and feel of a diagram, and it can also be quite hard to maintain (for example, change the name of something, change the size of all nodes, etc.). There are a number of JavaScript diagrammers but very often they are complex and often don’t depict nodes and ports efficiently. The great project WaveDrom shows the way. Its job is to draw waveforms, but rather than provide an online WYSIWYG tool or omnibus draw anything library, it lets the user describe the diagram in a very domain specific JSON right in the page. Wavedrom then renders the wave in SVG.
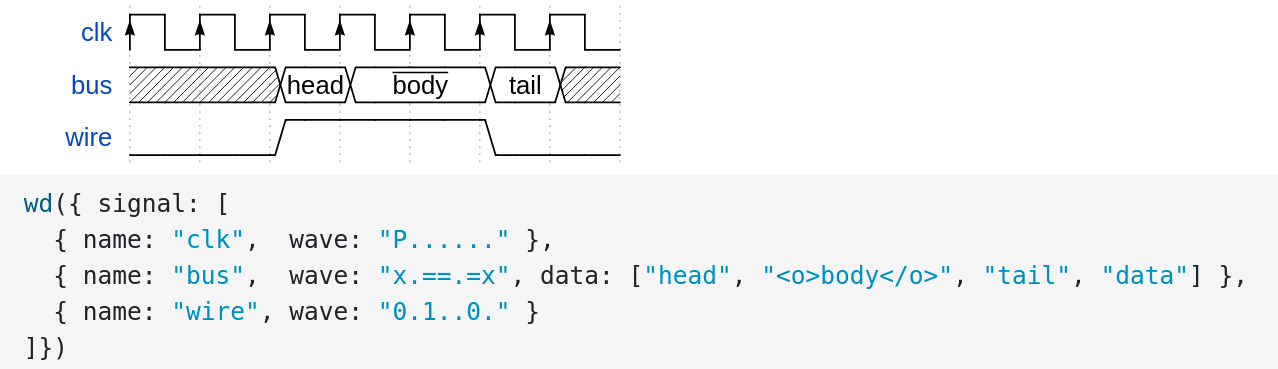
Here you can see the JSON describing the waveform and the resulting output. This is very convenient, it can be modified easily, customized and so on.
Back to rendering HDL, it should be noted that a much more sophisticated tool than HDElk exists, called netlistsvg. This tool takes actual output from the incredible open source synthesizer, Yosys and renders the actual logic.

This is an SVG sample from the home page. Clearly if you want real diagrams generated from actual code, NetListSVG is the project to look into. NetListSVG uses ElkJS for its layout, and was an inspiration for HDElk.
Simple Example
What does HDElk do, and what does it look like? Here’s a simple diagram
There are nested nodes, and edges that connect them together, via node ports. Edge direction is represented by a small glyph on the end and there is a mechanism to represent buses (thicker lines) as distinct from plain wires.
And here’s the code that created it. If you view the source of this page, you’ll see the exact code below twice! Once doing the work and another time for the documentation.
<div id="simple_diagram"></div>

<script type="text/javascript">

    var simple_graph = {
        id: "Simple",
        children: [
            { id: "in", port: 1 },
            { id: "one", ports: ["in", "out"] },
            { id: "two", highlight:1, ports: ["in", "out"] },
            { id: "three", ports: ["in", "out"] },
            { id: "out", port: 1 }
        ],
        edges: [
            ["in","one.in"],
            {route:["one.out","two.in"],highlight:1},
            {route:["two.out","three.in"],highlight:1,bus:1},
            {route:["three.out","out"], bus:1 }
        ]
    }

    hdelk.layout( simple_graph, "simple_diagram" );
</script>
While this is very far from Verilog or VHDL, you can see that the structure is set out in relatively simple JSON, with no hints as to how it should appear. HDElk does all the layout work automatically for us, finally adding the SVG into the web page <div>
We’ll cover this much more in the Tutorial but for now there are two main features to point out:
-
childrenis an array of nodes, which may have ports and may describe other things that modify the node’s appearance or behavior, like labels, highlighting and so on. -
edgesis an array of connections between child nodes, where each edge describes its start and end point, whether it’s a bus or not and whether it is highlighted.
For completeness, somewhere the following library files need to be loaded. They are available from the repo here
<script src="/js/elk.bundled.js"></script>
<script src="/js/svg.min.js"></script>
<script src="/js/hdelk.js"></script>
How it Works
The system is based around ElkJS, a JavaScript translation of Elk, the Eclipse Layout Kernel. This codebase takes textual specifications of a graph of nodes and edges and arranges them into something that can be displayed on a 2D screen. That is where ElkJs ends, with a JavaScript object with added locations and sizes. From there something has to render the objects, adding styles, etc. This is what HDElk does with the help of SVG.js, a small library that makes generating SVG trivial. HDElk.js is a single file, well under 1000 lines.
ElkJS uses a rather long form of description.
const graph = {
  id: "root",
  layoutOptions: { 'elk.algorithm': 'layered' },
  children: [
    { id: "n1", width: 30, height: 30 },
    { id: "n2", width: 30, height: 30 },
    { id: "n3", width: 30, height: 30 }
  ],
  edges: [
    { id: "e1", sources: [ "n1" ], targets: [ "n2" ] },
    { id: "e2", sources: [ "n1" ], targets: [ "n3" ] }
  ]
}
This snippet is from the ElkJS home page, illustrating how it can be a little long winded. Ports are not even presented in this snippet - they are another large structure.
To get around the lengthy input files, HDElk provides a simple preprocessor that takes a simplified form of diagram description and outputs what is required for ElkJS to run.
As an example, you can see above, ElkJS needs an edge between n1 and n2, to look like this:
{id:"e1", sources:["n1"], targets:["n1"]}
This is a great general structure, flexible, and fine for machine generation, but less than ideal for hand coding. The HDElk preprocessor internally, lets us shrink it to:
{source:"n1", target:"n2"}
removing the need to explicitly name the edge, and removing the arrays needed for sources and targets. Of course if you need multiples sources and or targets, you can still use the longer form. In one step further,
["one","two"]
we remove the need for the object and replacing it with a much simpler array of two strings.
Here’s how the same description would look in HDElk
var graph = {
  id: "root",
  children: [
    { id: "n1" },
    { id: "n2" },
    { id: "n3" }
  ],
  edges: [
    ["n1","n2" ],
    ["n1","n3" ]
  ]
}
And here it is rendered by HDElk
Roughly what happens when you submit a graph to HDElk is shown below:
- The diagram is described in JSON, and passed to HDElk.layout() along with a
<div>id. - HDElk then calls
transform()to convert the compact HDElk description into the format Elk.js can use. - Elk.js does its magic, adding dimensions and locations to the diagram description and returning this back to HDElk.
HDElk.diagram()recursively operates on the post-Elk diagram description creating the appearance of the diagram.- It calls SVG.JS to help generate the SVG output.
- HDElk’s last act is to insert the SVG into the appropriate host page’s
<div>.
The two main functions that do HDElk work are transform() and diagram() both are short, simple and live in hdelk.js. There is no language translation step, no bundler or publisher. The idea is that anyone who uses the project should just be able to reach into these functions and modify them if they wish.
Future Work
Enhancements
- Push Error Messages Into the Div When there is a problem, make sure error messages are visible
- Create a Style system There is only one “style”, any others are the “find the place in the code and change it” kind
- Add instructions for use with Node.js So far this is a browser focused effort.
- Document what the highlight colors are Not noted anywhere.
- Add more highlight colors Orange and Purple!
Bugs
- Elk Node Label Bug There seems to be a bug when labels are not centered. The space allowed is made twice as big as it should be. Leaf nodes in HDElk have centered labels so this is OK, but parent nodes do reserve too label space since the labels are H_CENTER, V_TOP
- Elk Self Connection Label Bug Labels on edges connecting two ports on the same node do not appear.
- Enable Low Level Drawing Since all the code is right there, it would be easy to call into it to create manual diagrams - i.e. without Elk. This could be helpful when trying to do something different.
- Look into why Elk pulls sw.js fairly regularly Does this only happen locally?
Please feel free to create Issues and Pull Requests.